Over 160 people participated in our 2019 Veg Challenge (June 22-July 13, 2019) and we obtained 24 pairs of before and after results. Shown below are results for all animal products and each of the individual products that we asked about.
ALL ANIMAL PRODUCTS
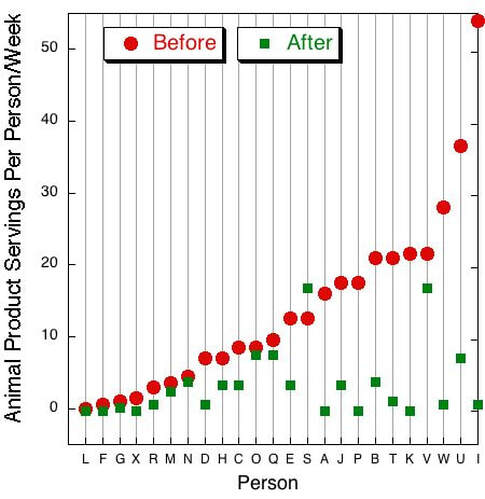
The animal products that we asked about were chicken, turkey, fish/seafood, pork, beef, other meat, dairy, and eggs. The median consumption per week of all of these combined decreased from 11.00 servings to 2.25 servings. This decrease was very significant based on the sign test, which yielded a one-tail p value of less than 0.0001, which means that there is less than a 1 in 10,000 chance that there was no difference between the before and after results.
We graphed out the individual survey results in which each respondent was assigned a letter and the before results are shown as red circles and the after results as green squares. We sorted the data by the lowest to highest consumption before the Veg Challenge. With only one exception, everyone decreased their animal product consumption (the green squares are below the red circles). The results are the most dramatic for those who started out with a higher level of animal product consumption.
ALL ANIMAL PRODUCTS
The animal products that we asked about were chicken, turkey, fish/seafood, pork, beef, other meat, dairy, and eggs. The median consumption per week of all of these combined decreased from 11.00 servings to 2.25 servings. This decrease was very significant based on the sign test, which yielded a one-tail p value of less than 0.0001, which means that there is less than a 1 in 10,000 chance that there was no difference between the before and after results.
We graphed out the individual survey results in which each respondent was assigned a letter and the before results are shown as red circles and the after results as green squares. We sorted the data by the lowest to highest consumption before the Veg Challenge. With only one exception, everyone decreased their animal product consumption (the green squares are below the red circles). The results are the most dramatic for those who started out with a higher level of animal product consumption.
CHICKENS
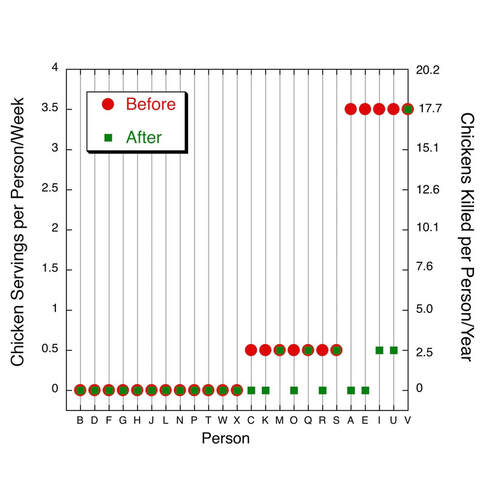
Consumption of chicken by the Veg Challengers was generally quite low even before the Challenge started, but it still decreased significantly. The median consumption per week of the 24 respondents decreased from 0.25 servings to 0 servings. This decrease was significant based on the sign test, which yielded a one-tail p value of 0.0039.
We converted servings per week to number of chickens killed per year. The number of chickens killed per serving is estimated based on available data on average weight at slaughter, “eatable” weight, and average serving sizes. For “broiler” chickens, the average live weight of a young chicken was 6.12 pounds in 2015 and the average dressing percentage of a “broiler” is 71%, resulting in 4.34 pounds of eatable weight per chicken. The typical serving size for chicken is 6 ounces of broiled chicken breast or 7-8 ounces for three pieces of fried chicken, which results in 10.33 servings per chicken, or 0.097 chickens killed per serving. Based on this conversion, the median number of chickens killed per person/year decreased from 1.26 to 0.
As above, we graphed out the individual survey results in which each respondent was assigned a letter and the before results are shown as red circles and the after results as green squares. Half of the survey respondents didn’t eat chicken at the beginning, the majority of the rest decreased their consumption, and no one increased consumption.
TURKEYS
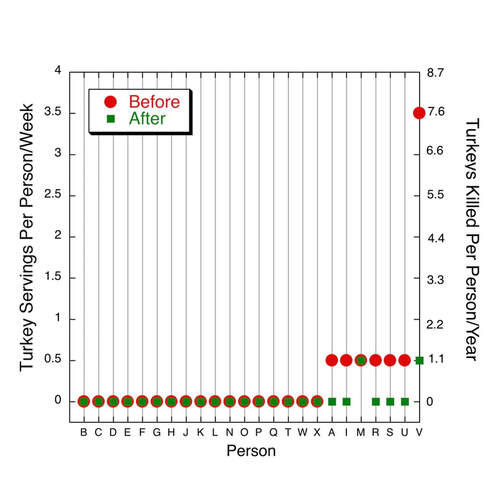
Our survey of turkey consumption by Veg Challenge participants showed that there was a significant decrease in the amount eaten. Consumption of turkeys by the 24 respondents to the before and after surveys was quite low even before the Challenge started, but it still decreased significantly, based on the sign test, which yielded a one-tail p value of 0.0156.
We converted servings per week to number of turkeys killed per year. The number of turkeys killed per serving is estimated based on available data on average weight at slaughter, “eatable” weight, and the average serving size. The average live weight of a young turkey was 30.12 pounds in 2015 and the average dressing percentage is 79%, resulting in 23.8 pounds of eatable weight per turkey. As an estimate of serving size, the USDArecommends“When selecting your turkey, allow 1 pound of turkey per personfor fresh or frozen”. Dividing 23.8 pounds by 1 pound per serving yields 23.8 servings per turkey, or 0.042 turkeys killed per serving.
To graph out the individual survey results, each respondent was assigned a letter and the before results are shown as red circles and the after results as green squares. More than half of the survey respondents didn’t eat turkey at the beginning, and all but one decreased their consumption. No one increased consumption.
PIGS
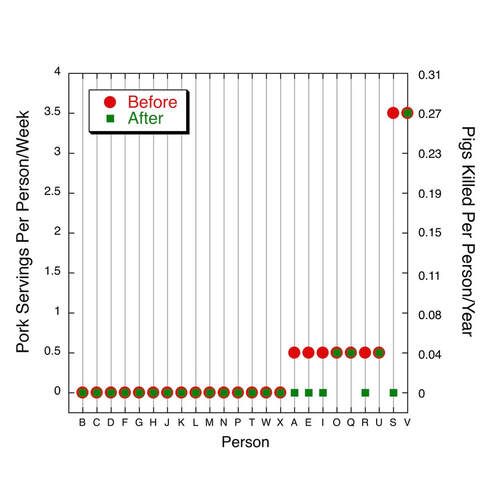
Our survey of pork consumption by Veg Challenge participants showed that there was a significant decrease in the amount eaten. Consumption of pigs by the 24 respondents to the before and after surveys was quite low even before the Challenge started, but it still decreased significantly, based on the sign test, which yielded a one-tail p value of 0.0313.
We converted servings per week to number of pigs killed per year. The number of pigs killed per serving is estimated based on available data on average weight at slaughter, “eatable” weight, and the average serving size. For pigs, the average dressed weight of a hog in 2015 was 213 pounds. As an estimate of serving size, the amount of ham in a deli sandwich is 5 ounces.Dividing 213 pounds by 5 ounces (0.313 pounds) yields 681 servings per pig, or 0.00147 pigs killed per serving.
We graphed out the individual survey results as above. More than half of the survey respondents didn’t eat pork at the beginning, and that majority of the survey respondents decreased their consumption (the green squares are below the red circles). No one increased their consumption of pork.
AQUATIC ANIMALS
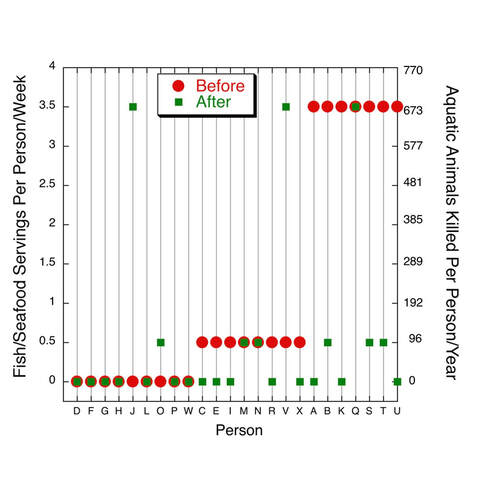
Our survey of fish/seafood consumption by Veg Challenge participants showed that there was a significant decrease in the amount eaten. The median consumption per week of the 24 respondents decreased from 0.5 servings to 0 servings. This decrease was significant based on the sign test, which yielded a one-tail p value of 0.0287.
We estimated how servings per week translated to number of sea animals killed per year. This was rather complicated considering the vast numbers of sea animals, their relative sizes, and the relative numbers eaten. The calculations took into consideration per capita consumption data, average weights, the proportions of specific subcategories of finned fish, and commercial classifications of shrimp, crabs, and clams. Also, the calculations only consider the fish who are eaten by humans, and therefore are an underestimate of the fish killed, because fish caught unintentionally and discarded (bycatch) are not included. Based on a serving size of 6 ounces, the average number of aquatic animals killed per serving is 3.79. Based on this conversion, the median number of sea animals killed per person/year decreased from 96.2 to 0.
We graphed out the individual survey results as above. More participants decreased their fish/seafood consumption than increased. However, three people did increase their consumption. One of these reported that a naturopath had advised her that she could only obtain omega-3 fatty acids from fish. Unfortunately this is a common misconception, but we can get all that we need from plant sources, as described here.
BEEF
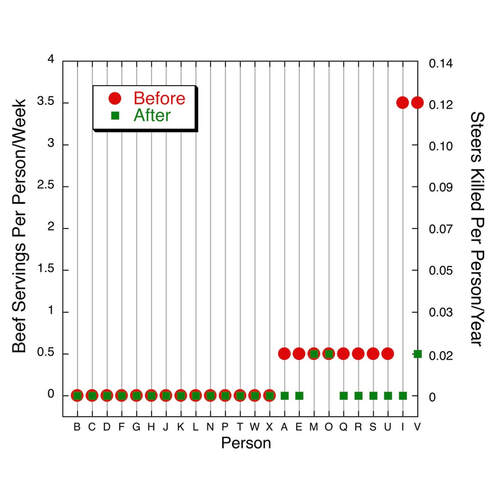
There was a significant decrease in the amount of beef eaten after the Veg Challenge. Consumption by the 24 survey respondents was quite low even before the Challenge started, but it still decreased significantly, based on the sign test, which yielded a one-tail p value of 0.0078.
We converted servings per week to number of steers killed per year. The number of steers killed per serving is estimated based on available data on average weight at slaughter, “eatable” weight, and the average serving size. For steers, the average dressed weight in 2015 was 892 pounds. As an estimate of serving size, a sirloin steak is 8 ounces (cooked and trimmed), a Porterhouse steak or prime rib is 13 ounces (cooked and trimmed), and the amount of roast beef in a deli sandwich is 5 ounces. Averaging these serving sizes yields 8.67 ounces, or 0.54 pounds. Dividing 892 pounds by 0.54 pounds per serving yields 1,652 servings per steer or 0.000654 steers killed per serving.
We graphed out the individual survey results as above. More than half of the survey respondents didn’t eat beef at the beginning, and that majority of the other respondents decreased their consumption. No one increased their consumption of beef.
OTHER MEAT
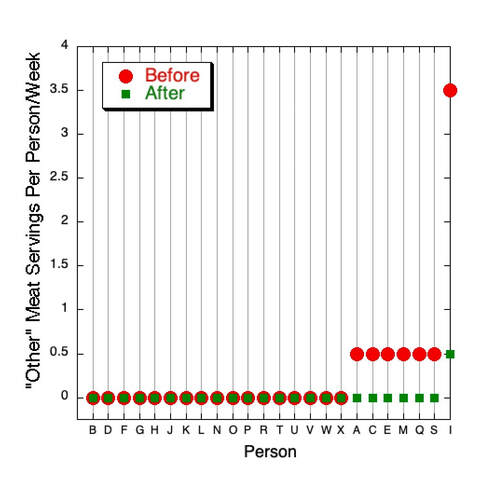
Deers, lambs, goats, ducks, and geese have the dubious distinction of being classified as “other meat” in our surveys. As with the other animal products, there was a significant decrease in the amount eaten. Consumption was quite low even before the Challenge started, but it still decreased significantly, based on the sign test, which yielded a one-tail p value of 0.0078.
We graphed out the individual survey results as above. The vast majority of the survey respondents didn’t eat them at the beginning and all but one stopped eating them entirely. This person, who had started out with the highest consumption, decreased consumption by a factor of 7.
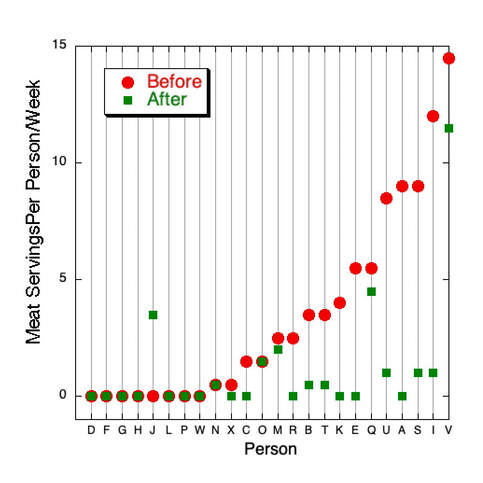
ALL MEAT
We are pleased that the Veg Challenge participants made significant progress in reducing their total consumption of meat. Included in this category were chicken, turkey, fish/seafood, pork, beef, and other meat. The median consumption per week of all of these combined by the 24 survey respondents decreased from 2 to 0 servings. This decrease was significant based on the sign test, which yielded a one-tail p value of 0.0005.
We graphed out the individual survey results as above. The majority of the respondents either decreased their meat consumption after the Veg Challenge or didn’t consume any even at the beginning. Only one person started eating meat.
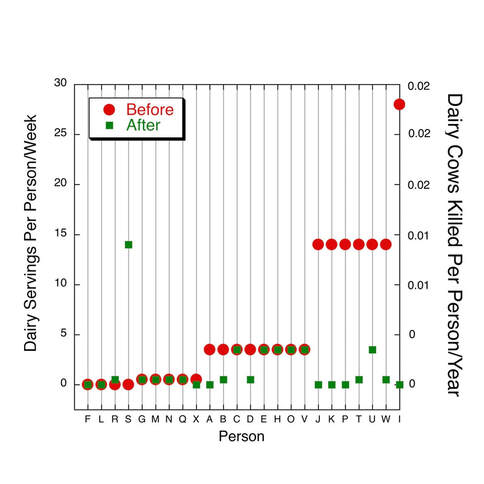
DAIRY
Based on our survey of dairy (milk, cheese, yogurt, ice cream, etc.) consumption, there was a significant decrease in the amount eaten after the Veg Challenge. The median consumption per week of the 24 respondents decreased from 3.5 servings to 0.5 servings.This decrease was significant based on the sign test, which yielded a one-tail p value of 0.0017.
We converted dairy servings per week to the number of dairy cows killed per year. In 2012, the milk production per cow in the U.S. was ~22,000 pounds. A typical cow is sent to slaughter when less than 4 years old. A cow who produces milk for 4 years will produce ~87,000 pounds. Based on USDA reports on per capita dairy product availability numbers (which can be used as a proxy for per capita consumption) and calculations of the milk equivalent of dairy products, a serving size of dairy equivalent to 1 cup of milk (0.54 pounds) represents 1/64,000 of the total output of a dairy cow, which results in 0.000016 cows killed per serving. While this number may seem infinitesimal, please remember that dairy production involves intense suffering, which includes separation of cows from their newborn calves and does not include the number of male calves killed for veal.
We graphed out the individual survey results as above. Half of the survey decreased their consumption. Of the remainder, there was only one major increase in consumption.
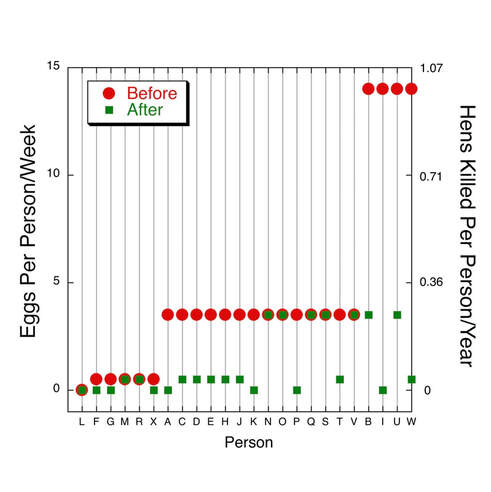
EGGS
Our survey of egg consumption showed that there was a very significant decrease in the amount eaten after the Veg Challenge. The median consumption per week of the 24 respondents decreased from 3.5 servings to 0.5 servings. We assumed a serving equaled one egg, which may be an underestimate. This decrease was very significant based on the sign test, which yielded a one-tail p value of <0.0001.
We converted eggs per week to number of hens killed per year. Most commercial laying strains of hens produce an egg almost daily and are slaughtered after about two years. Assuming a lifespan of 2 years, one hen will produce 730 eggs in her lifetime, resulting in 0.00137 hens killed per egg. Based on this conversion, the median number of hens killed per person/year decreased from 0.25 to 0.04. While these numbers may seem small, please keep in mind that egg laying hens must endure even worse living and dying conditions than most factory farmed animals. Also, the calculations don't include the male chicks who are discarded at birth because they are useless to the egg industry. You can learn more about all this here.
We graphed out the individual survey results as above. The majority of the survey respondents decreased their consumption and no one increased consumption.
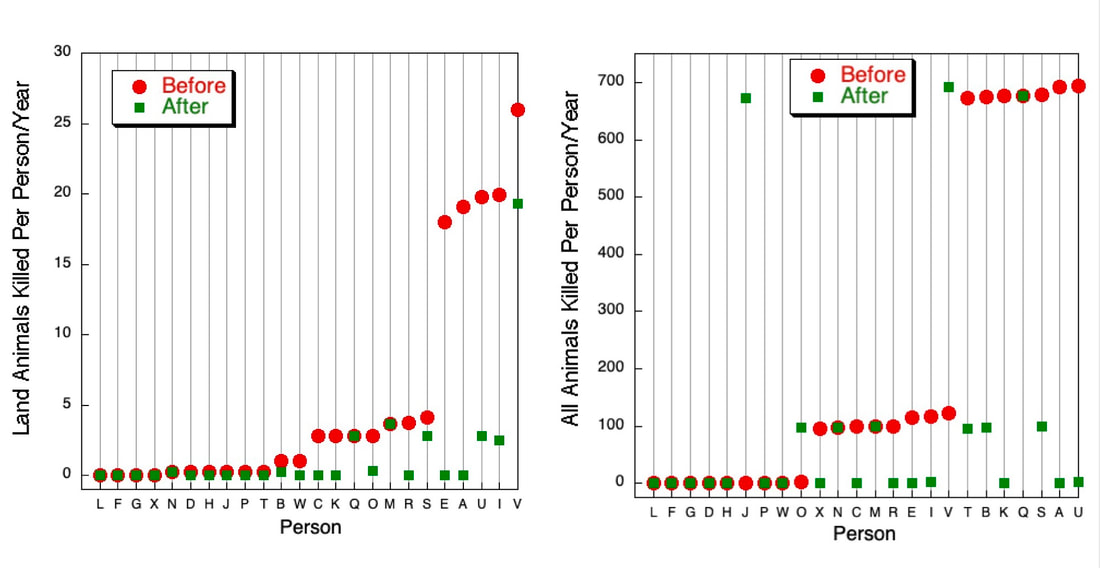
ALL ANIMALS
The number of animals killed for food is astronomical and can make the goal of saving them seem hopeless, but participants in this Veg Challenge had a promising impact.
Based on conversions of servings per week of chicken, turkey, fish/seafood, pork, beef, dairy, and eggs consumed by the 24 survey respondents to animals killed per year, median consumption of land animals per year decreased from 1.89 to 0.04. Median consumption of all animals per year decreased from 99.42 to 0.04. Both decreases were significant, with one-tail p values of <0.0001 (land animals) and 0.0007 (all animals).
Fish/aquatic animals comprise the majority of all animals and chickens account for most of the land animals killed for food. Based on data from the Food and Agriculture Organization of the United Nations (FAO), 3 billion mammals and 57 billion birds were killed for food in 2008. Globally, between 37 and 120 billion fish are killed on commercial farms each year, with another 2.7 trillion caught and killed in the wild. In the U.S. alone, ~9 billion chickens die for human consumption each year. These numbers are from here.
By decreasing the demand for animal flesh and products, we can decrease the numbers of animals killed for food.
KNOWLEDGE
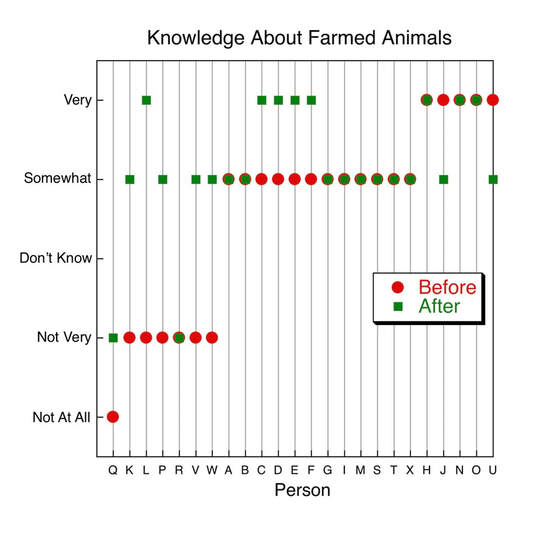
Knowledge is powerful! In this Veg Challenge, we provided participants with information about the many compelling reasons for going vegan, including facts about animal agriculture that many people are not aware of. Not only did the 24 survey respondents show spectacular decreases in consumption of animals and their products, but they also indicated a significant increase in their perceived knowledge about issues that affect animals raised for food. Although the median degree of knowledgeability remained at “somewhat”, there was a significant increase with a one-tail p value of 0.0193. We graphed out the individual survey results as above. Of the people who reported a change in their knowledge, the majority felt more knowledgeable afterwards.
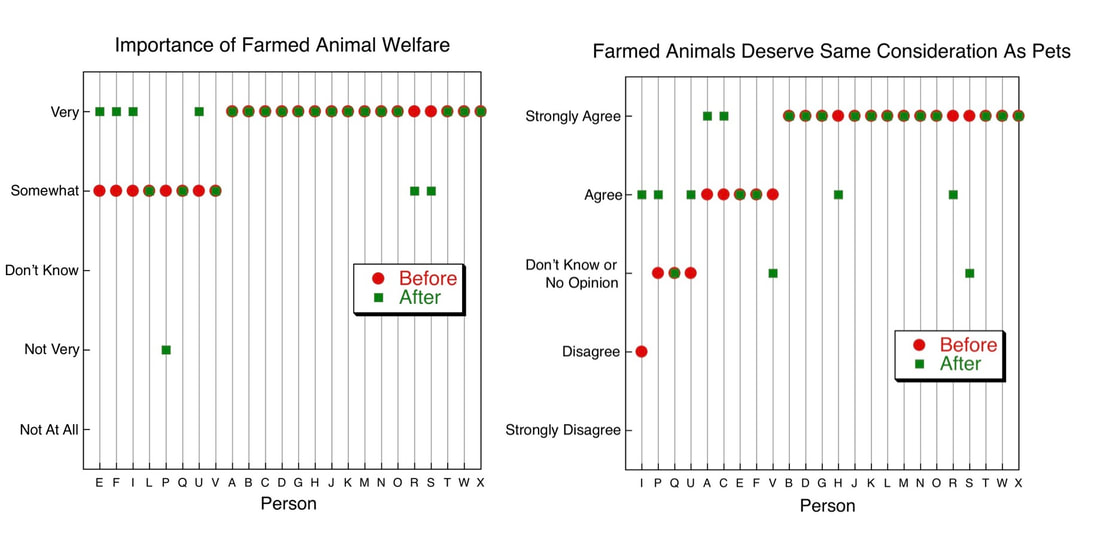
We had suspected that regardless of their knowledgeability of animal issues, most of the Veg Challengers would care about farmed animal welfare. This was confirmed by two additional survey questions. In response to “How important to you is the welfare and protection of animals raised for food?” the median response was “very important” both before and after with no significant change (one-tail p value of 0.5). Similarly, in response to “Do you agree or disagree that farm animals deserve the same consideration as pets and other animals?” the median response was “strongly agree” both before and after with no significant change (one-tail p value of 0.5).
These results are very encouraging because they indicate that most people are concerned about farmed animals and that becoming aware of what they have to endure helps people to stop eating them.
Knowledge is powerful! In this Veg Challenge, we provided participants with information about the many compelling reasons for going vegan, including facts about animal agriculture that many people are not aware of. Not only did the 24 survey respondents show spectacular decreases in consumption of animals and their products, but they also indicated a significant increase in their perceived knowledge about issues that affect animals raised for food. Although the median degree of knowledgeability remained at “somewhat”, there was a significant increase with a one-tail p value of 0.0193. We graphed out the individual survey results as above. Of the people who reported a change in their knowledge, the majority felt more knowledgeable afterwards.
We had suspected that regardless of their knowledgeability of animal issues, most of the Veg Challengers would care about farmed animal welfare. This was confirmed by two additional survey questions. In response to “How important to you is the welfare and protection of animals raised for food?” the median response was “very important” both before and after with no significant change (one-tail p value of 0.5). Similarly, in response to “Do you agree or disagree that farm animals deserve the same consideration as pets and other animals?” the median response was “strongly agree” both before and after with no significant change (one-tail p value of 0.5).
These results are very encouraging because they indicate that most people are concerned about farmed animals and that becoming aware of what they have to endure helps people to stop eating them.
VEGAN FOOD
So, what are participants in our most recent Veg Challenge eating now? They have shown impressive decreases in consumption of animals and their products. But are they going hungry? It doesn’t look like it!
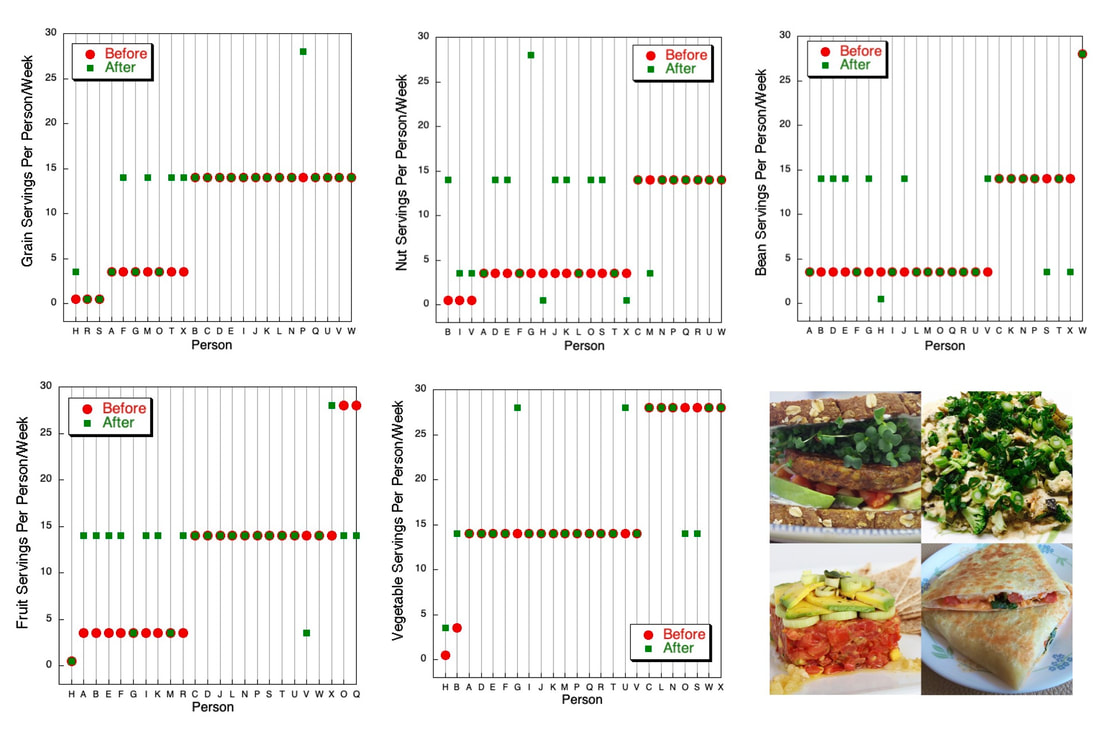
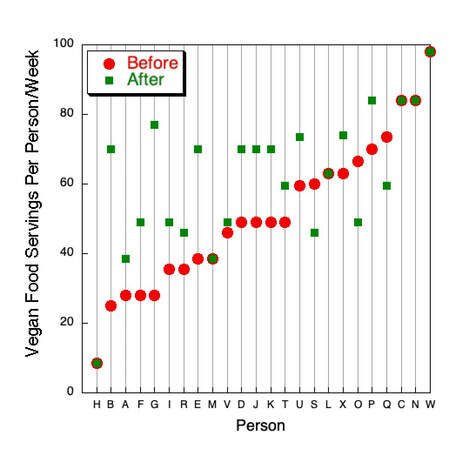
In addition to asking about consumption of animal products before and after the Veg Challenge, we also asked about vegan foods such as fruits, vegetables, beans, nuts, and grains. The median consumption per week of all of these combined increased from 49 to 66.50 servings per week. This increase was significant with a one-tail p value of 0.0007.
There was also a significant increase in consumption of grains, although the median both before and after was 14 servings per week. The one-tail p value was 0.0156. The median consumption of nuts increased significantly from 3.5 to 14 servings per week. The one-tail p value was 0.0461. The median consumption of beans increased from 3.5 to 8.75 servings per week, even if this increase missed being significant. The one-tail p value was 0.0898. The median fruit and vegetable consumption both before and after was 14 servings of each per week with no significant change (one-tailed p values of 0.1133 and 0.3438, respectively).
We graphed out the individual survey results as above.
To summarize, there are plenty of delicious and nutritious vegan replacements for animal products, and we are glad that the Veg Challengers are discovering them!
So, what are participants in our most recent Veg Challenge eating now? They have shown impressive decreases in consumption of animals and their products. But are they going hungry? It doesn’t look like it!
In addition to asking about consumption of animal products before and after the Veg Challenge, we also asked about vegan foods such as fruits, vegetables, beans, nuts, and grains. The median consumption per week of all of these combined increased from 49 to 66.50 servings per week. This increase was significant with a one-tail p value of 0.0007.
There was also a significant increase in consumption of grains, although the median both before and after was 14 servings per week. The one-tail p value was 0.0156. The median consumption of nuts increased significantly from 3.5 to 14 servings per week. The one-tail p value was 0.0461. The median consumption of beans increased from 3.5 to 8.75 servings per week, even if this increase missed being significant. The one-tail p value was 0.0898. The median fruit and vegetable consumption both before and after was 14 servings of each per week with no significant change (one-tailed p values of 0.1133 and 0.3438, respectively).
We graphed out the individual survey results as above.
To summarize, there are plenty of delicious and nutritious vegan replacements for animal products, and we are glad that the Veg Challengers are discovering them!